
2020 State of safety
As a new year begins, Safety+Health shares data to help paint a picture of the current safety landscape

Source: OSHA’s Top 10 most cited violations for 2019
| 3 ways to view the data: | |
|---|---|
| From this page: Browse data points as a slideshow by using the arrow buttons | 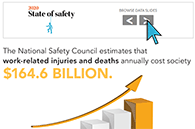 |
| See how the article appears in the print edition | 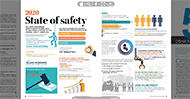 |
| Download the article as a .PDF file | 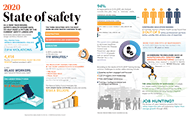 |
Post a comment to this article
Safety+Health welcomes comments that promote respectful dialogue. Please stay on topic. Comments that contain personal attacks, profanity or abusive language – or those aggressively promoting products or services – will be removed. We reserve the right to determine which comments violate our comment policy. (Anonymous comments are welcome; merely skip the “name” field in the comment box. An email address is required but will not be included with your comment.)