
2012 State of Safety: 'Danger sign'?
- Several possible causes exist for the statistical plateau, including a lower number of employed workers and an uncertain job market.
- A system used to reduce injuries and illnesses will be ineffective to drive those figures down further once the decreases level off, according to one expert.
- Musculoskeletal disorders, which account for nearly one-third of all injuries, saw its incident rate cases that resulted in days away from work increase in 2010.
The downward trend in injury
and illness rates is slowing
By Kyle W. Morrison, senior associate editor
For years, injuries, illnesses and fatalities have been on a downward trend. That trend, however, may be waning.
“This is the first year we’re starting to see it plateau,” said Ken Kolosh, manager of statistics for the National Safety Council’s Research and Statistical Services Department.
This past fall, the Bureau of Labor Statistics released three separate reports that, for the first time, jointly show that a reduction in fatal and nonfatal injuries and illnesses is slowing:
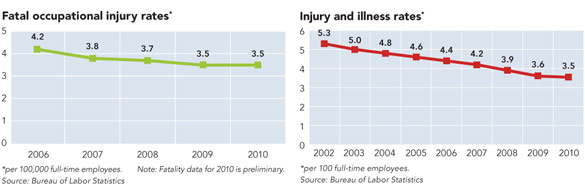
- Released Aug. 25, preliminary figures on fatal work injuries in 2010 (4,547) were about the same as the previous year (4,551), and both 2009 and 2010 had the same rate of fatalities per 100,000 full-time workers – 3.5. The 2010 numbers could increase, however, when BLS releases revised fatality data in the spring. In the past three years, increases in the number of fatalities have averaged 3 percent, according to BLS.
- An Oct. 20 report found that the rate of nonfatal injuries and illnesses per 100 full-time workers in 2010 was 3.5 – slightly less than the 3.6 rate in 2009. In previous years, this rate routinely has dropped at least two points from one year to the next.
- The rate of nonfatal injuries and illnesses that required days away from work in the private industry and local and state governments was 118 per 10,000 full-time workers – “statistically unchanged” from 2009, according to a Nov. 9 report. The private industry rate increased to 108 in 2010 from 106 in 2009, a departure from steady declines in previous years.
Several possible causes exist for the statistical plateau in occupational safety and health numbers, including a lower number of employed workers and an uncertain job market.
Regardless of the reasons, the stagnation has some safety professionals worried.
“Within an organization, it’s a danger sign if it’s hitting a plateau,” said Jim Johnson, group vice president of workplace safety initiatives at the National Safety Council.
When an employer’s safety management system becomes less effective in lowering injuries and illnesses and those decreases level off, that same system will likely be less effective in further driving down injuries and illnesses past the plateau, according to Johnson.
Employers need to look closely at what has effectively lowered injuries and illnesses and what is needed to improve, he said. Take a look at the safety management system, leadership role, employee engagement, hazard elimination and performance measurement, Johnson said, adding that employers need to understand their own data.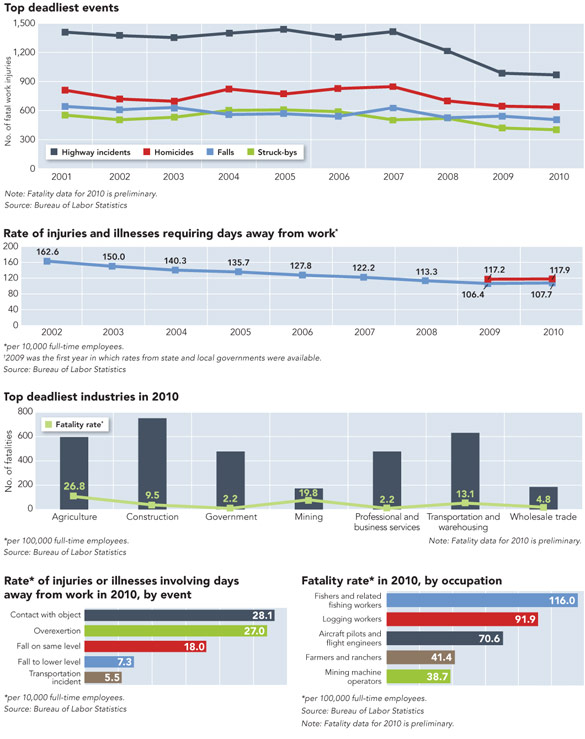
Familiar injuries
Many of the hazards that lead to injuries and illnesses are not new, yet still result in a high number of incidents each year. And, much like the overall trend seen in 2010, these common hazards appear to be hitting a plateau.
Contact with objects or equipment is one of the most common events that lead to injuries, and in 2010 caused 28.1 cases of days away from work per 10,000 full-time employees, essentially identical to the 28.3 cases the previous year. Likewise, overexertion (which is the leading event for several high-injury-rate occupations) experienced a rate of 27 in 2010, compared with 26.3 in 2009.
Musculoskeletal disorders, which account for nearly one-third of all injuries, saw its incident rate of cases that resulted in days away from work increase to 34.3 per 10,000 full-time employees in 2010 from 33 in 2009. According to some experts, MSD-related injuries are the most problematic – something that can end careers.
“That’s an ongoing issue,” said Jaime Murphy Dawson, senior policy analyst in the Center for Occupational and Environmental Health at the American Nurses Association in Silver Spring, MD. “It’s really the biggest and most costly occupational safety and health issue in the United States.”
When it comes to rates of MSD-related injuries that led to days away from work in 2010, two health care professions ranked at the very top: Nursing aides, orderlies and attendants experienced a rate of 249.4 per 10,000 full-time employees, and emergency medical technicians and paramedics had a rate of 237.9.
As to why such injuries remain an ongoing issue, Murphy Dawson speculated that it could be related to well-known trends within the industry – an aging workforce, low staff numbers, an increase in obesity, long work hours and a lack of safety equipment.
While ANA supports all efforts to reduce the risk of job hazards – including legislation or regulation – Murphy Dawson said one of the biggest components to this is creating a positive safety culture.
Nationally, Johnson believes the culture of safety in the United States – and as a result, the state of safety – is improving. Despite the evidence suggesting a current plateau of injuries and illnesses, or the possibility that some figures may slightly increase from year to year, Johnson said incremental progress will continue to lower rates in the long term.
“I believe there are more companies that do recognize [the value of safety], from the board level on down,” he said.
Post a comment to this article
Safety+Health welcomes comments that promote respectful dialogue. Please stay on topic. Comments that contain personal attacks, profanity or abusive language – or those aggressively promoting products or services – will be removed. We reserve the right to determine which comments violate our comment policy. (Anonymous comments are welcome; merely skip the “name” field in the comment box. An email address is required but will not be included with your comment.)