|
GO DIRECTLY TO A SECTION
|
BROWSE SALARY SURVEY SECTIONS
|
The annual Safety+Health Salary Survey is different this year. That’s because we’ve partnered with the Board of Certified Safety Professionals to bring you more – and more accurate* – information about how you compare with your fellow EHS pros on compensation and benefits.
S+H received responses from 984 workplace safety and health professionals, who shared information on a variety of topics.
On behalf of S+H and BCSP, Readex Research selected a sample of 61,500 EHS pros from two lists of National Safety Council members and active BCSP certification holders. An email was sent on April 22, and 9,225 recipients responded for a 15% response rate.
Thanks to everyone who responded to the survey. Ready to see how your salary stacks up? Read on. You can browse sections of the report by using the drop-down menu or navigation arrows at the top of each page.
*As part of this year’s partnership with BCSP, the Safety+Health Salary Survey has been thoroughly updated and expanded. Because of changes to question wording and response options, this year’s salary survey results are not comparable to previous years’ results.

The BCSP Salary Calculator
Want to drill down even further? Check out the BCSP Salary Calculator, which includes data from all 2020 Salary Survey respondents who indicated they were employed full time. By selecting different variables, you can build different queries based on location,
certification and more.
|
Sponsored by Columbia Southern University |
Next: About you | > |
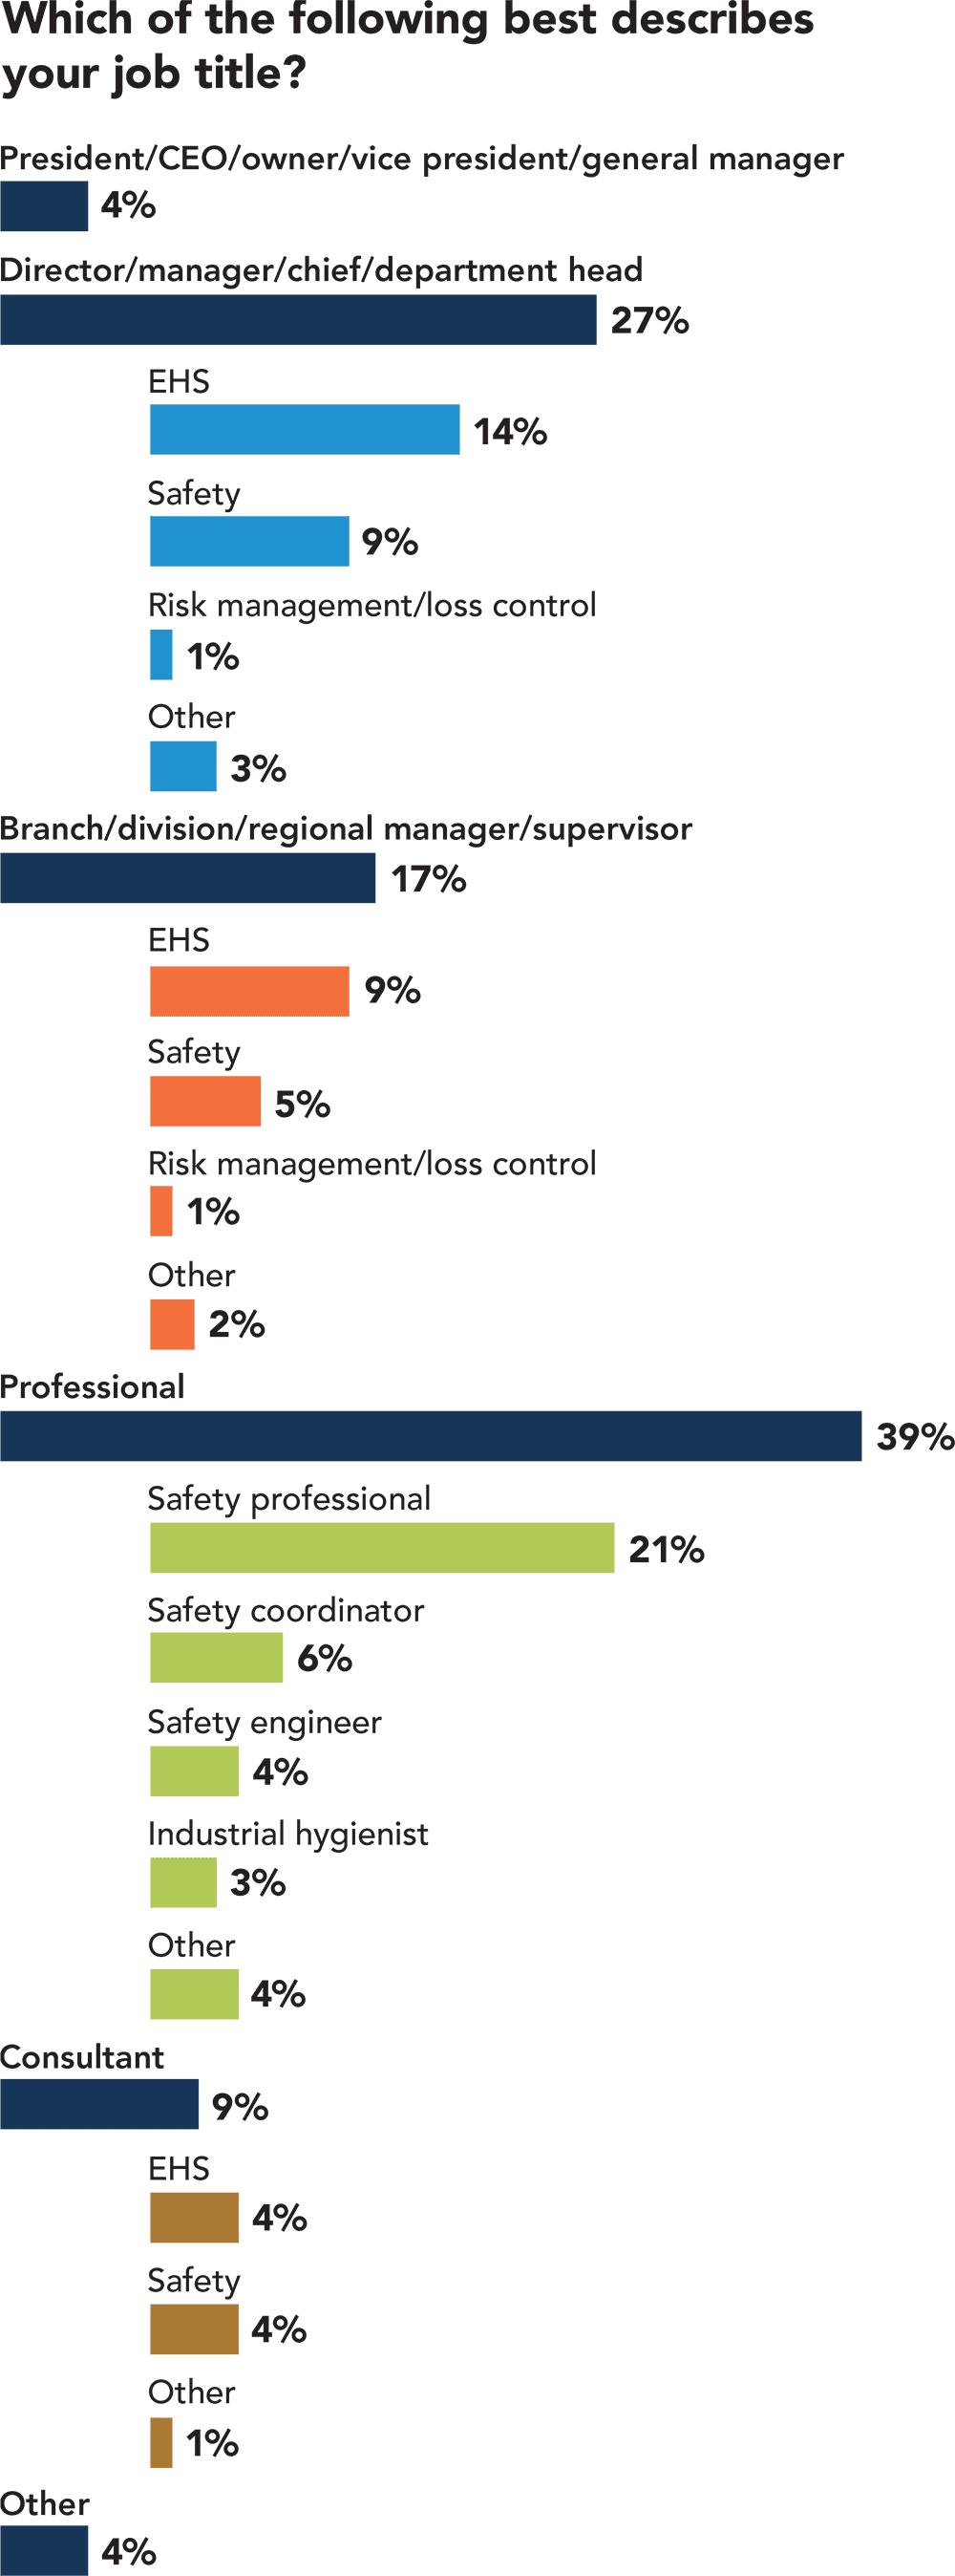
About you
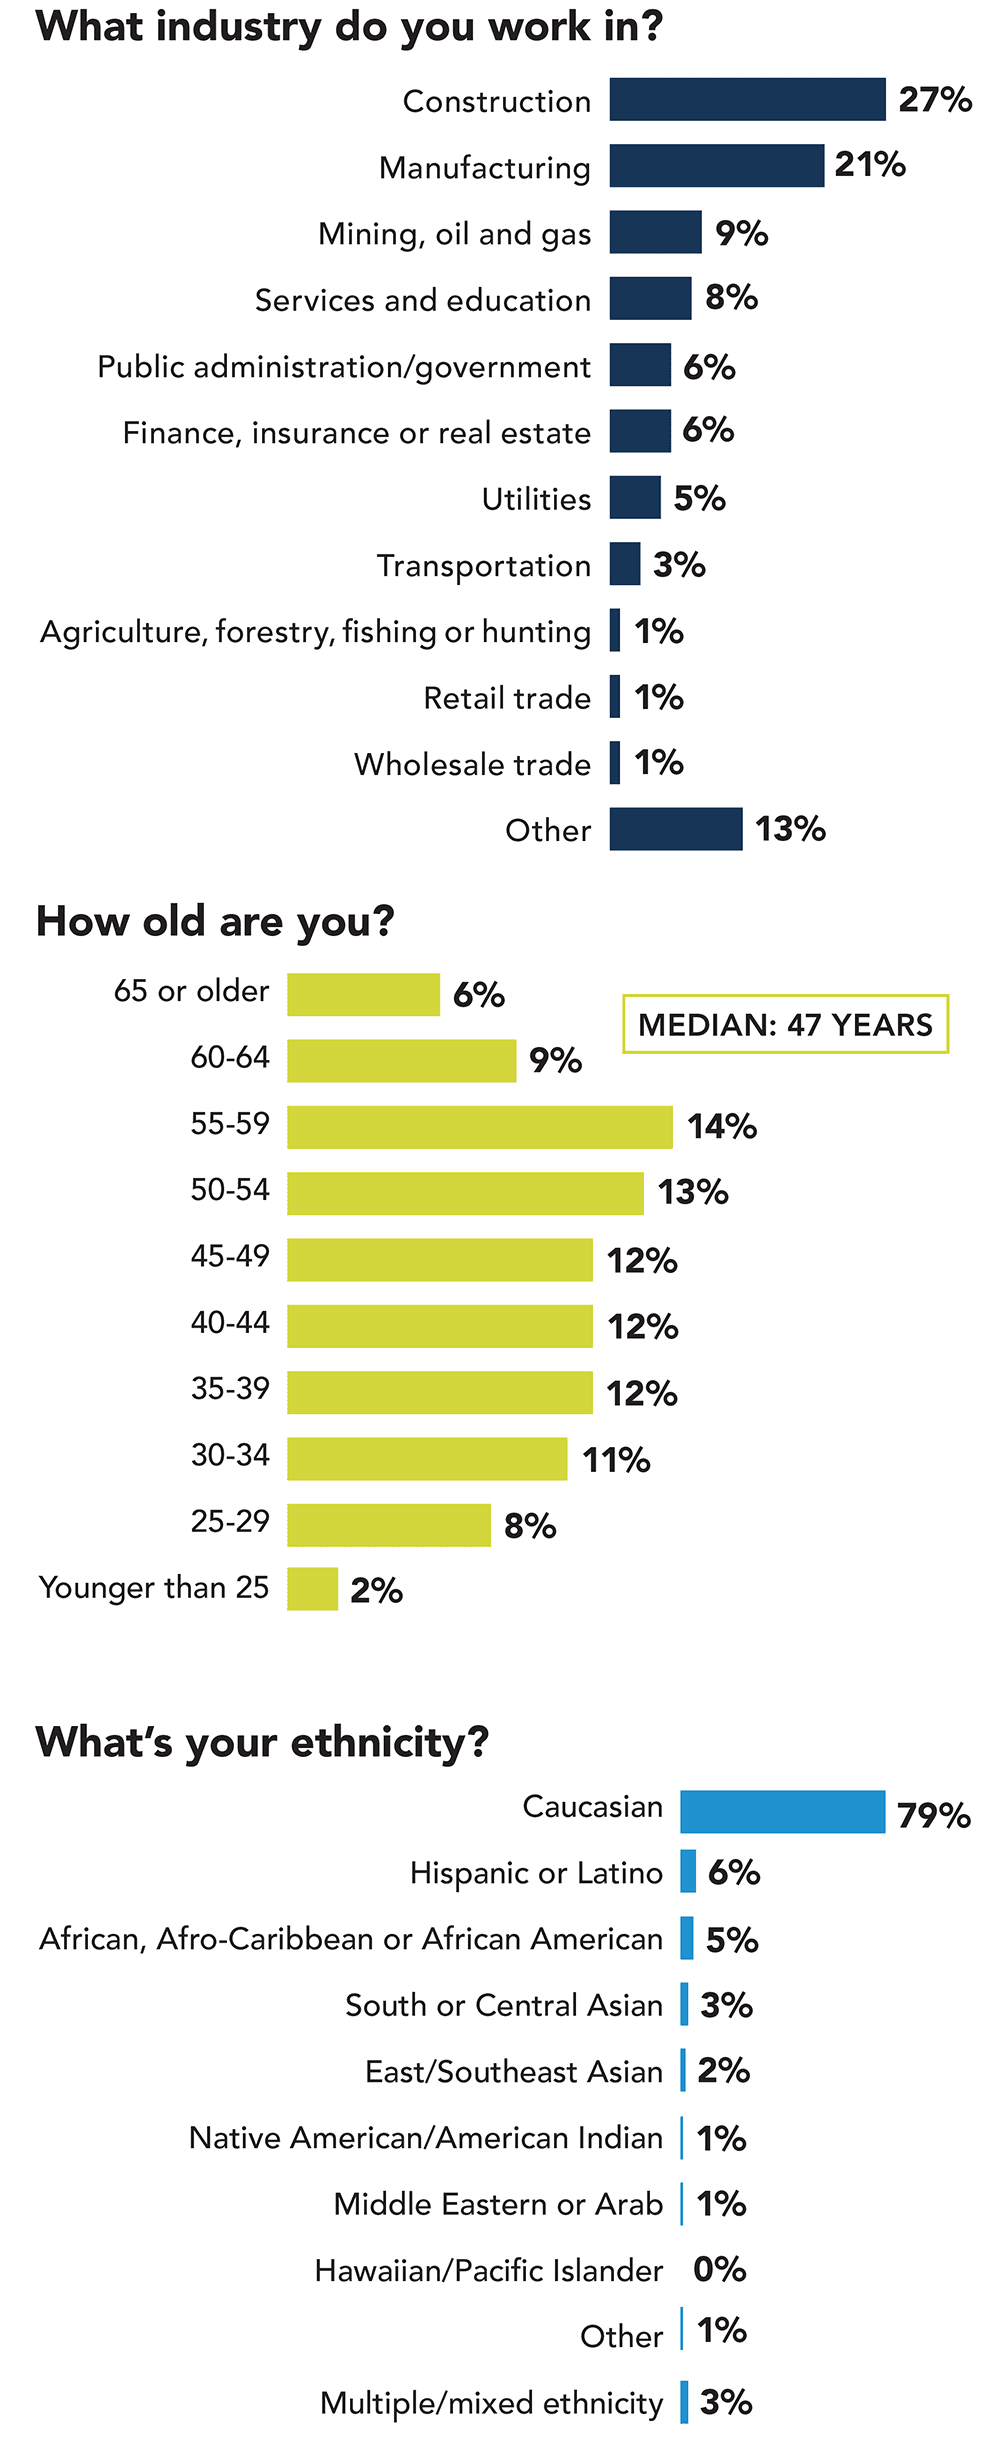
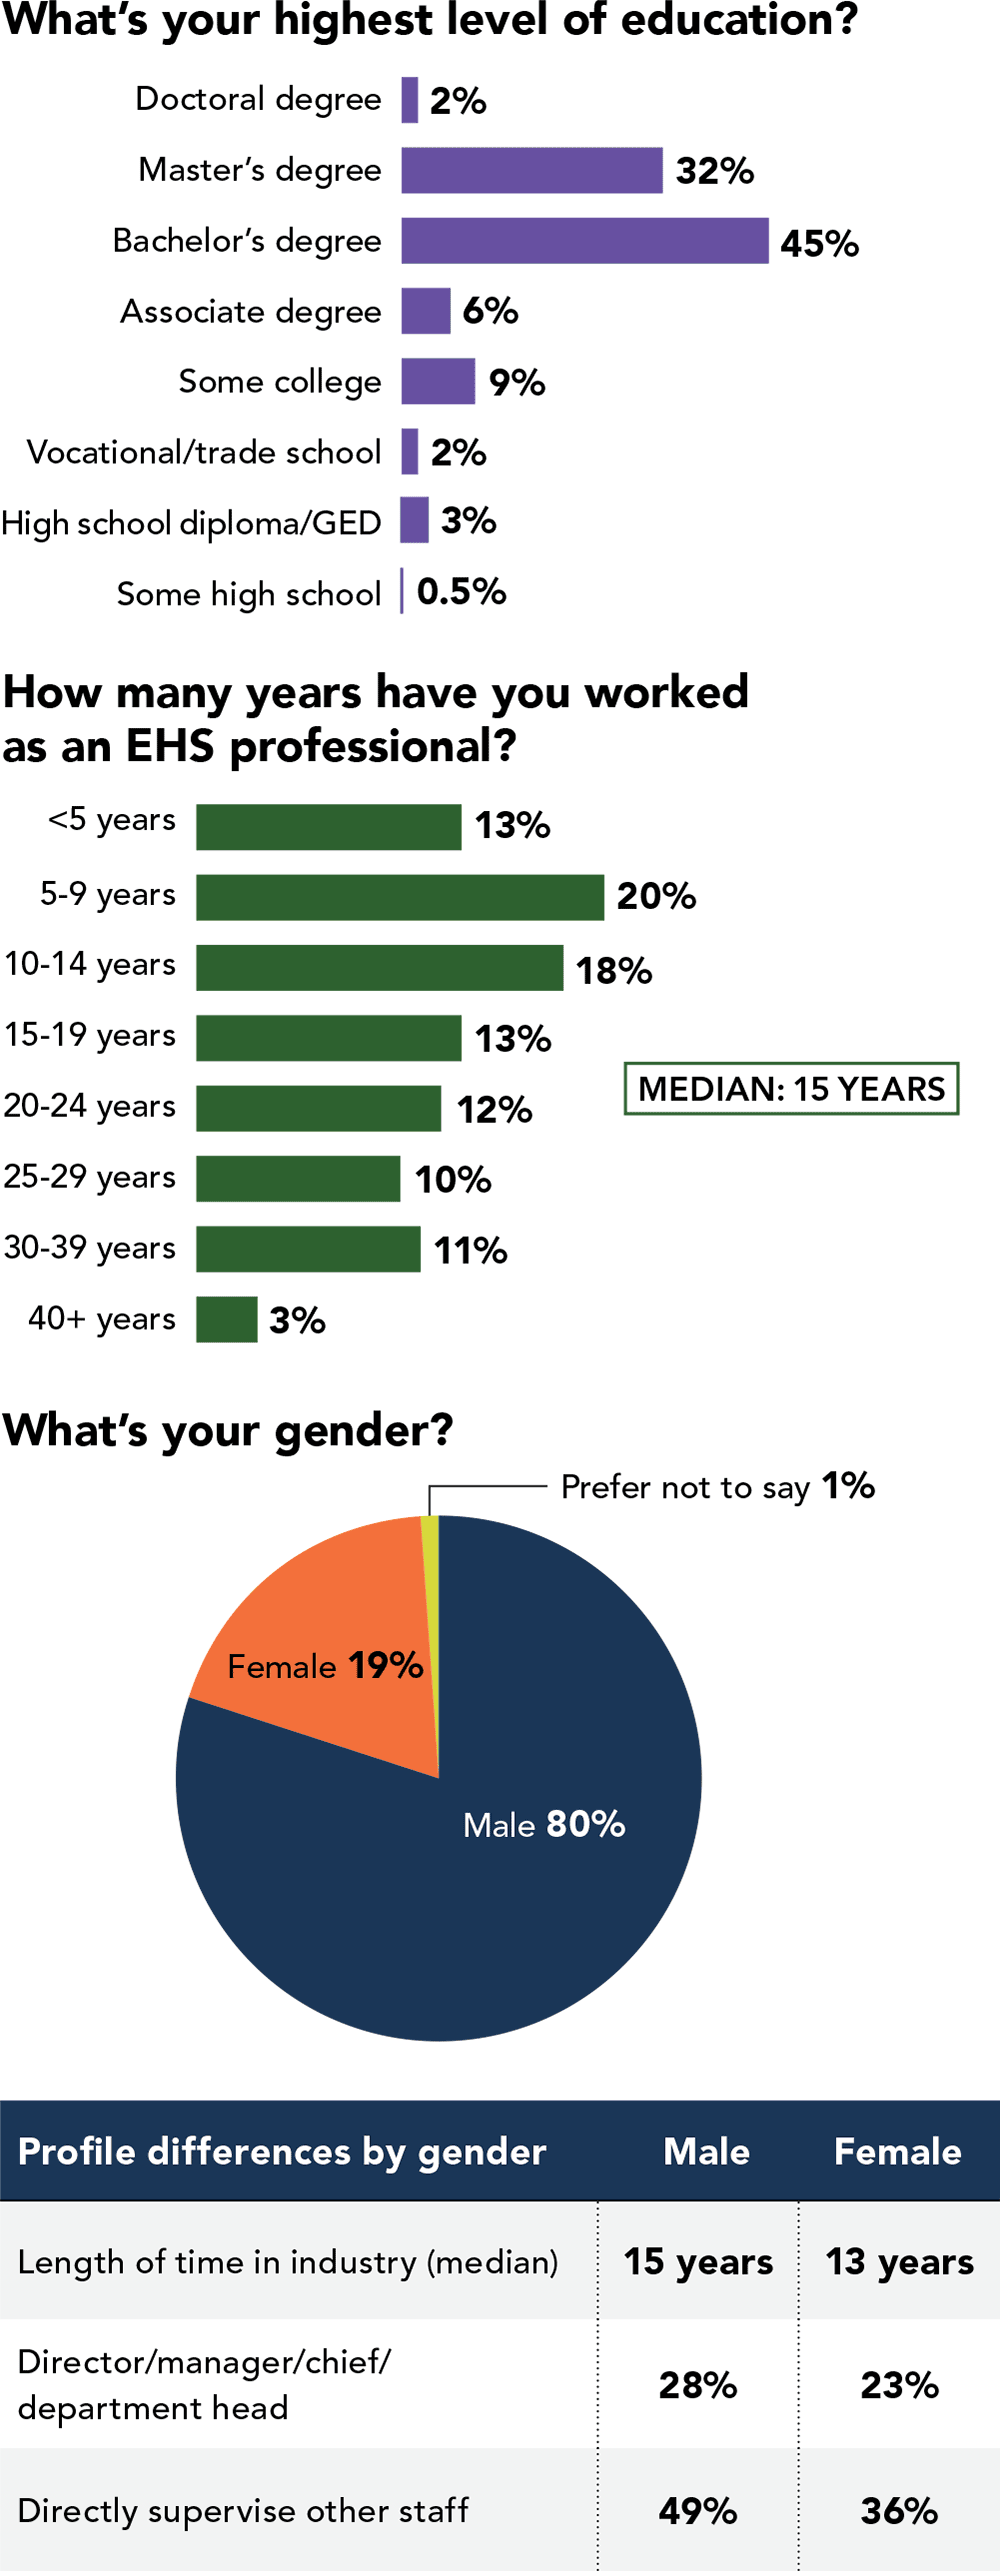
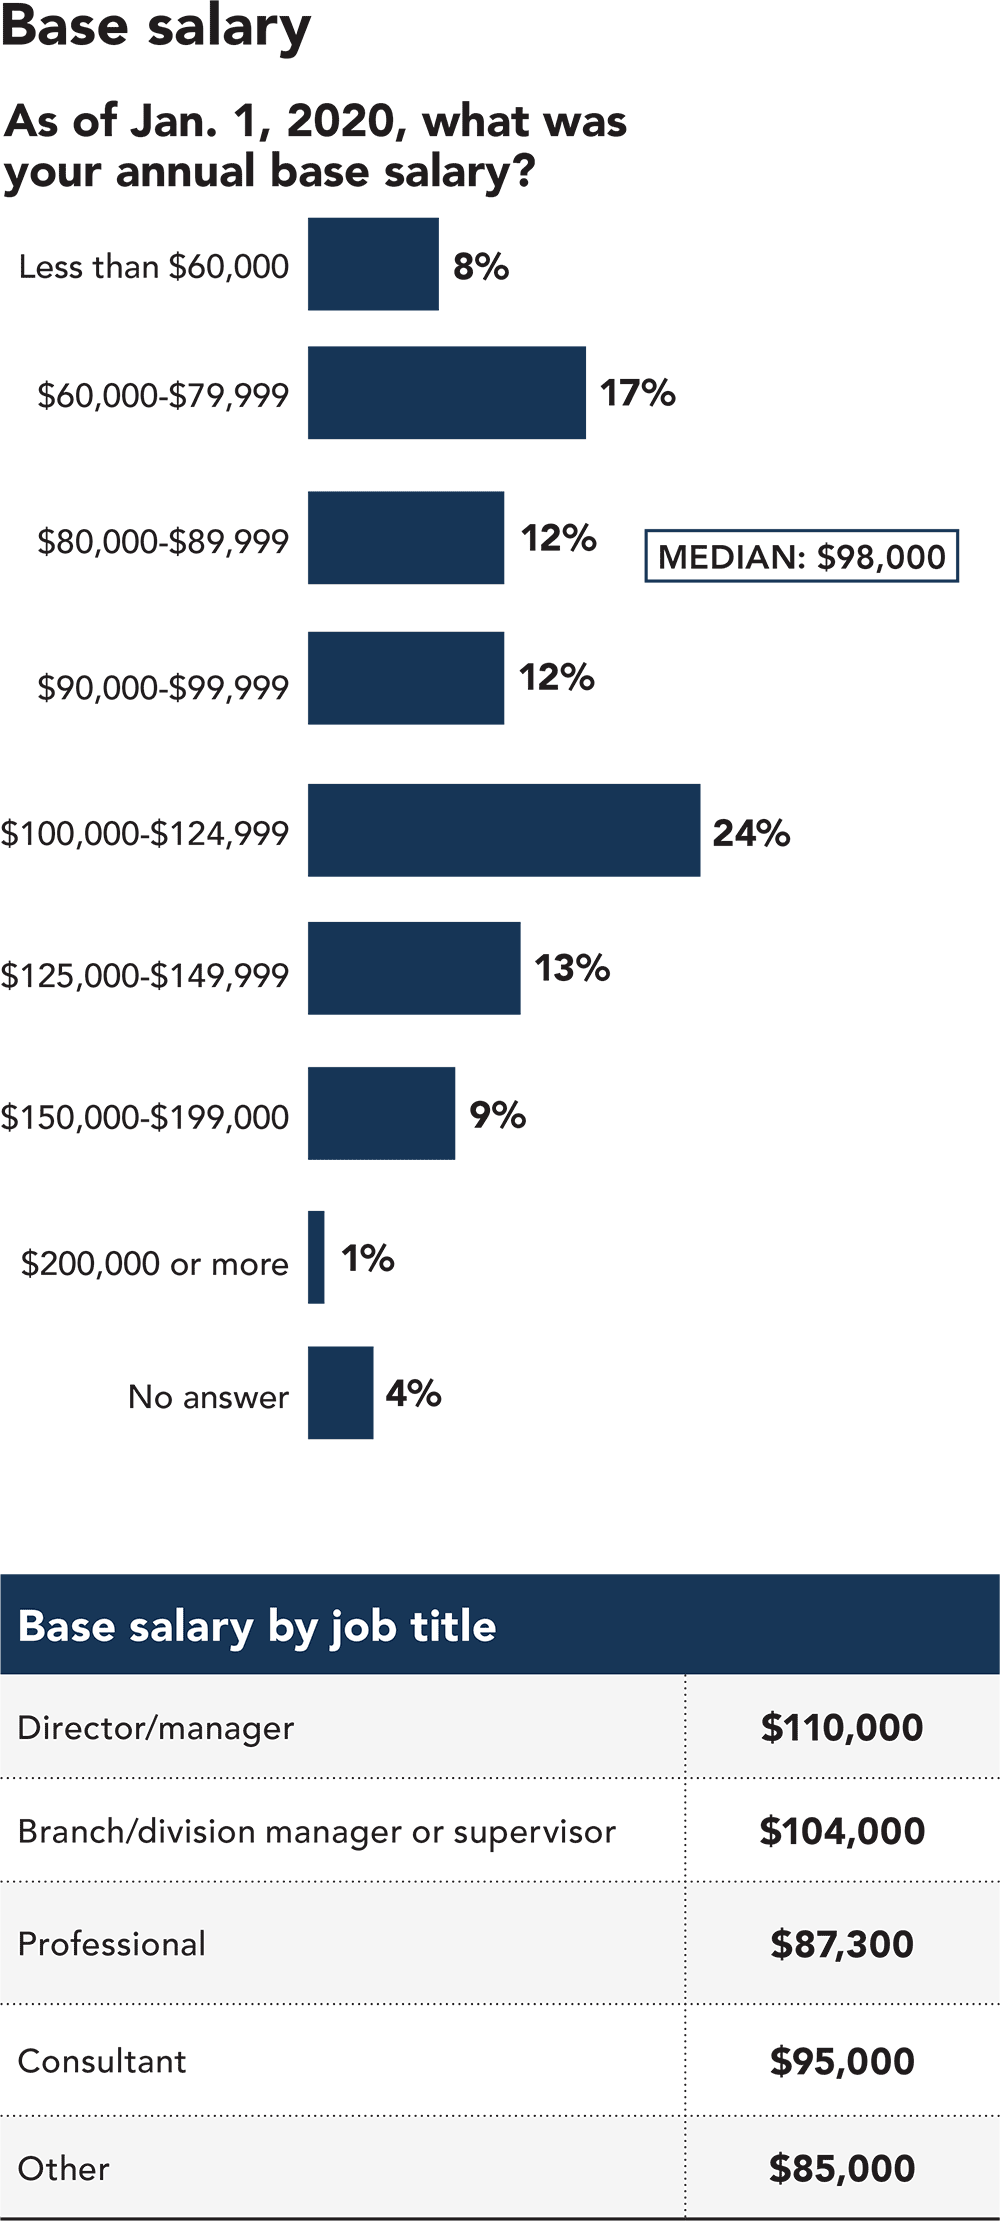
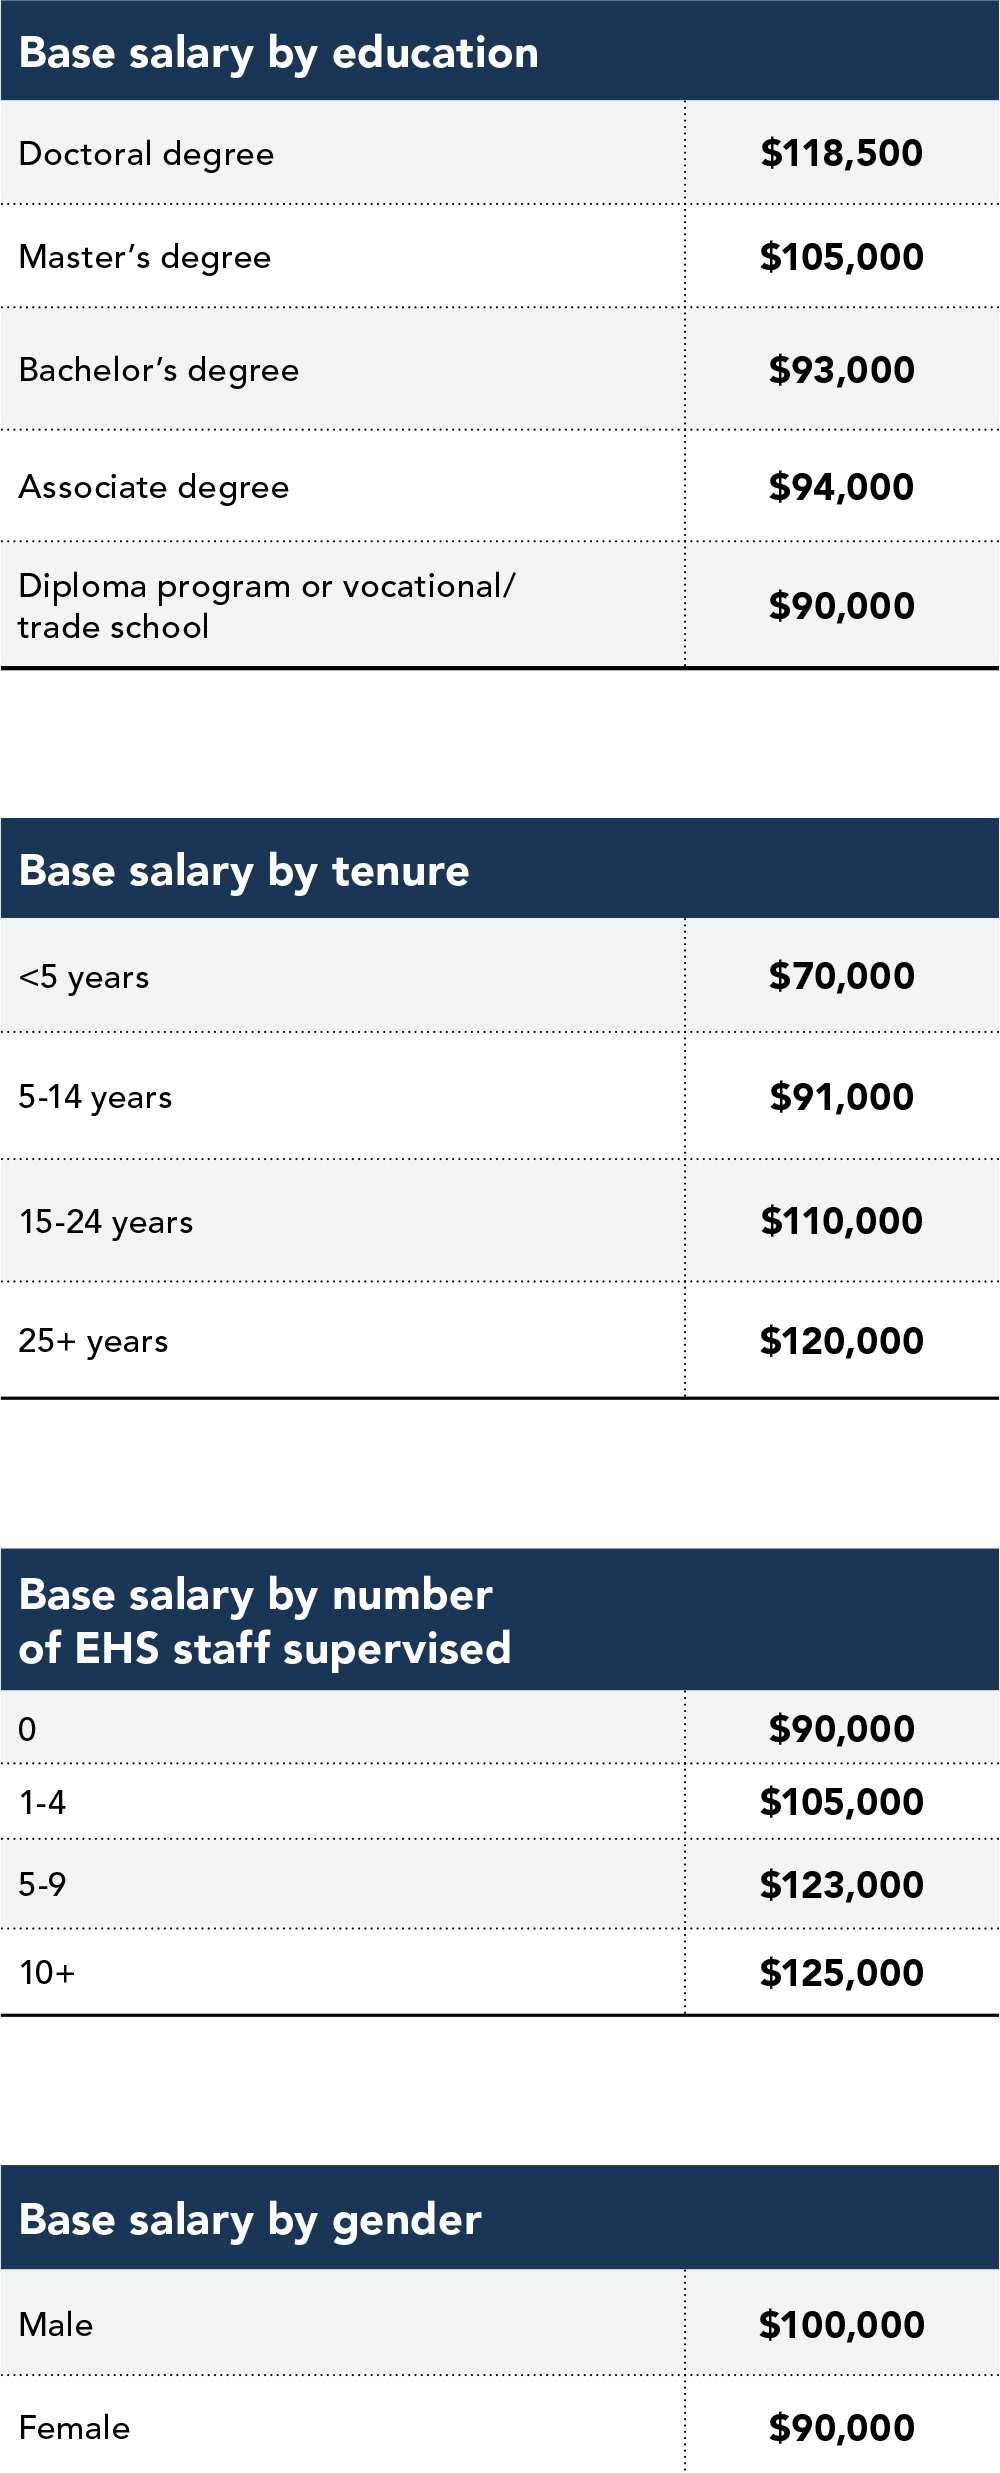
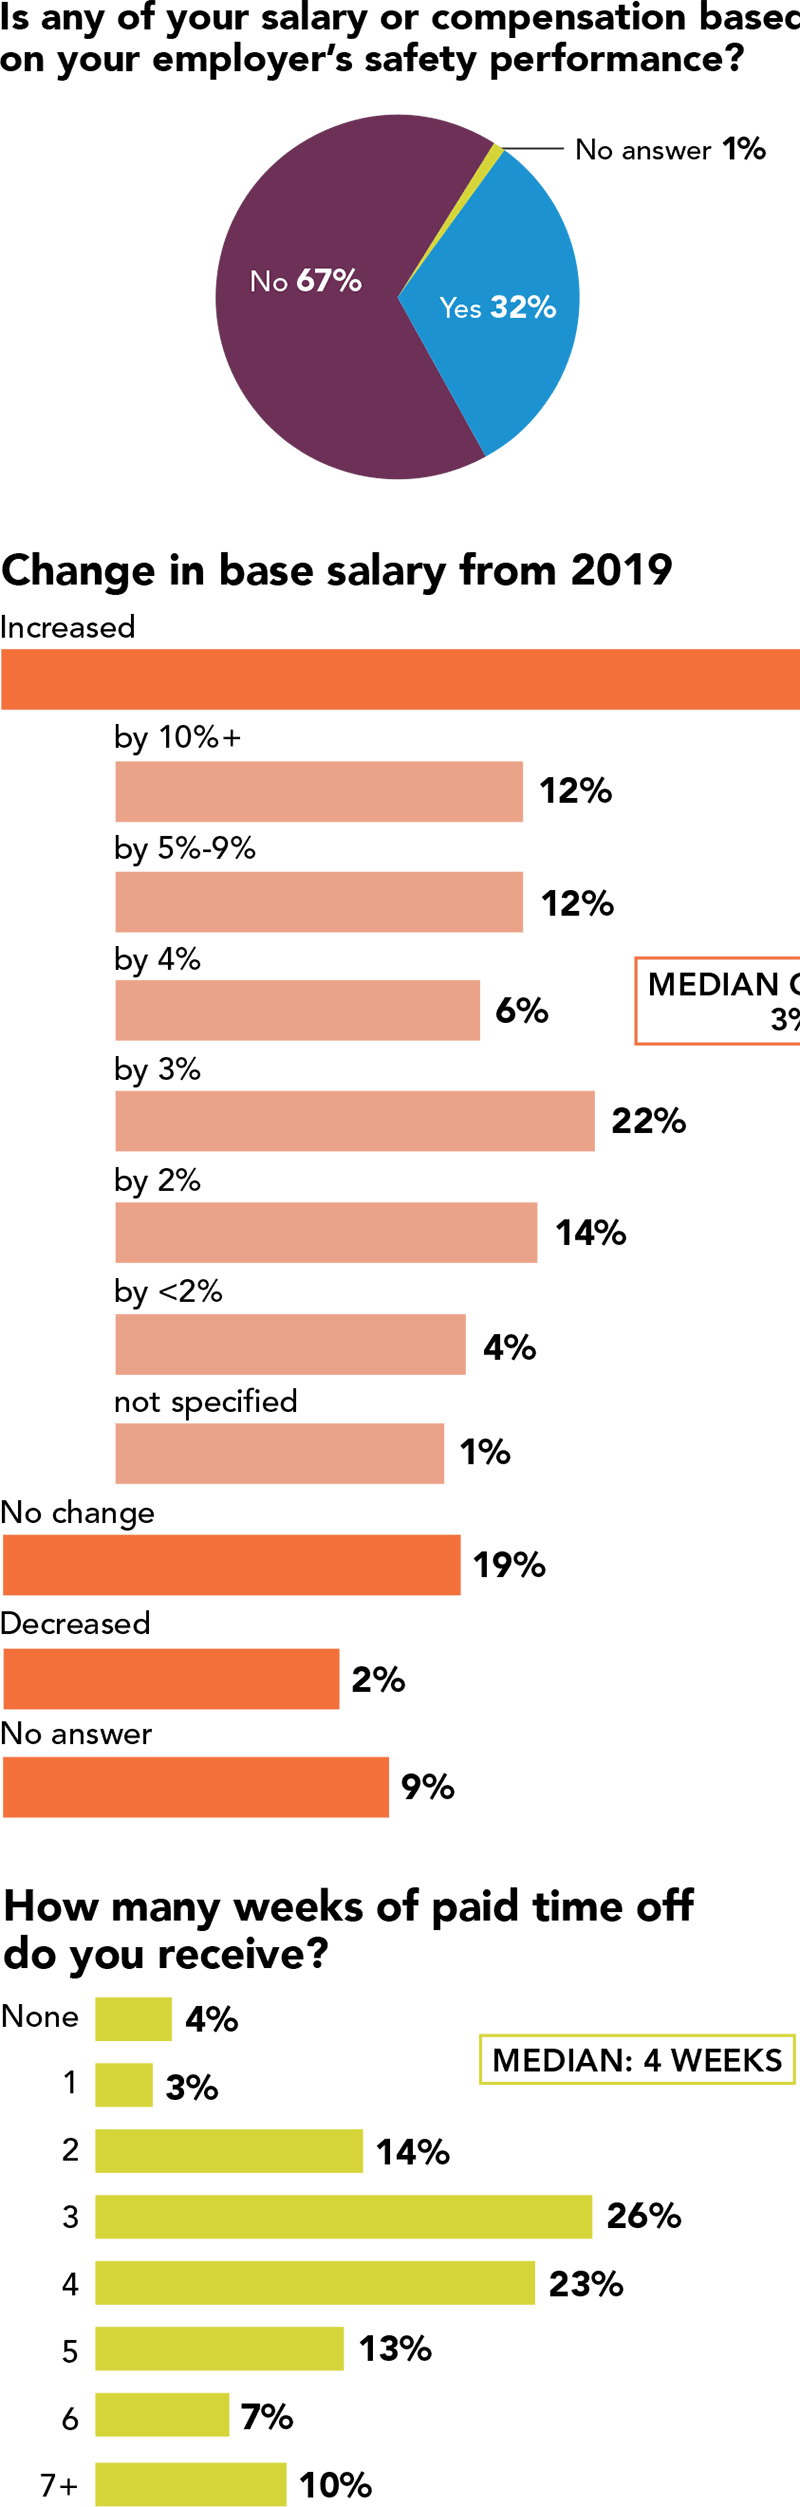
Note: Medians are reported in this study instead of means (averages) because medians represent the “typical” response and are not influenced
by extreme values. A median is the value that lies at the middle of a distribution; that is, 50% of the values are above it and 50% are below. Medians for grouped or categorical data are calculated by locating the group that contains the 50th percentile, then interpolating between the lower and upper bounds to estimate the precise value.
|
Sponsored by Columbia Southern University |
Next: About your organization | > |
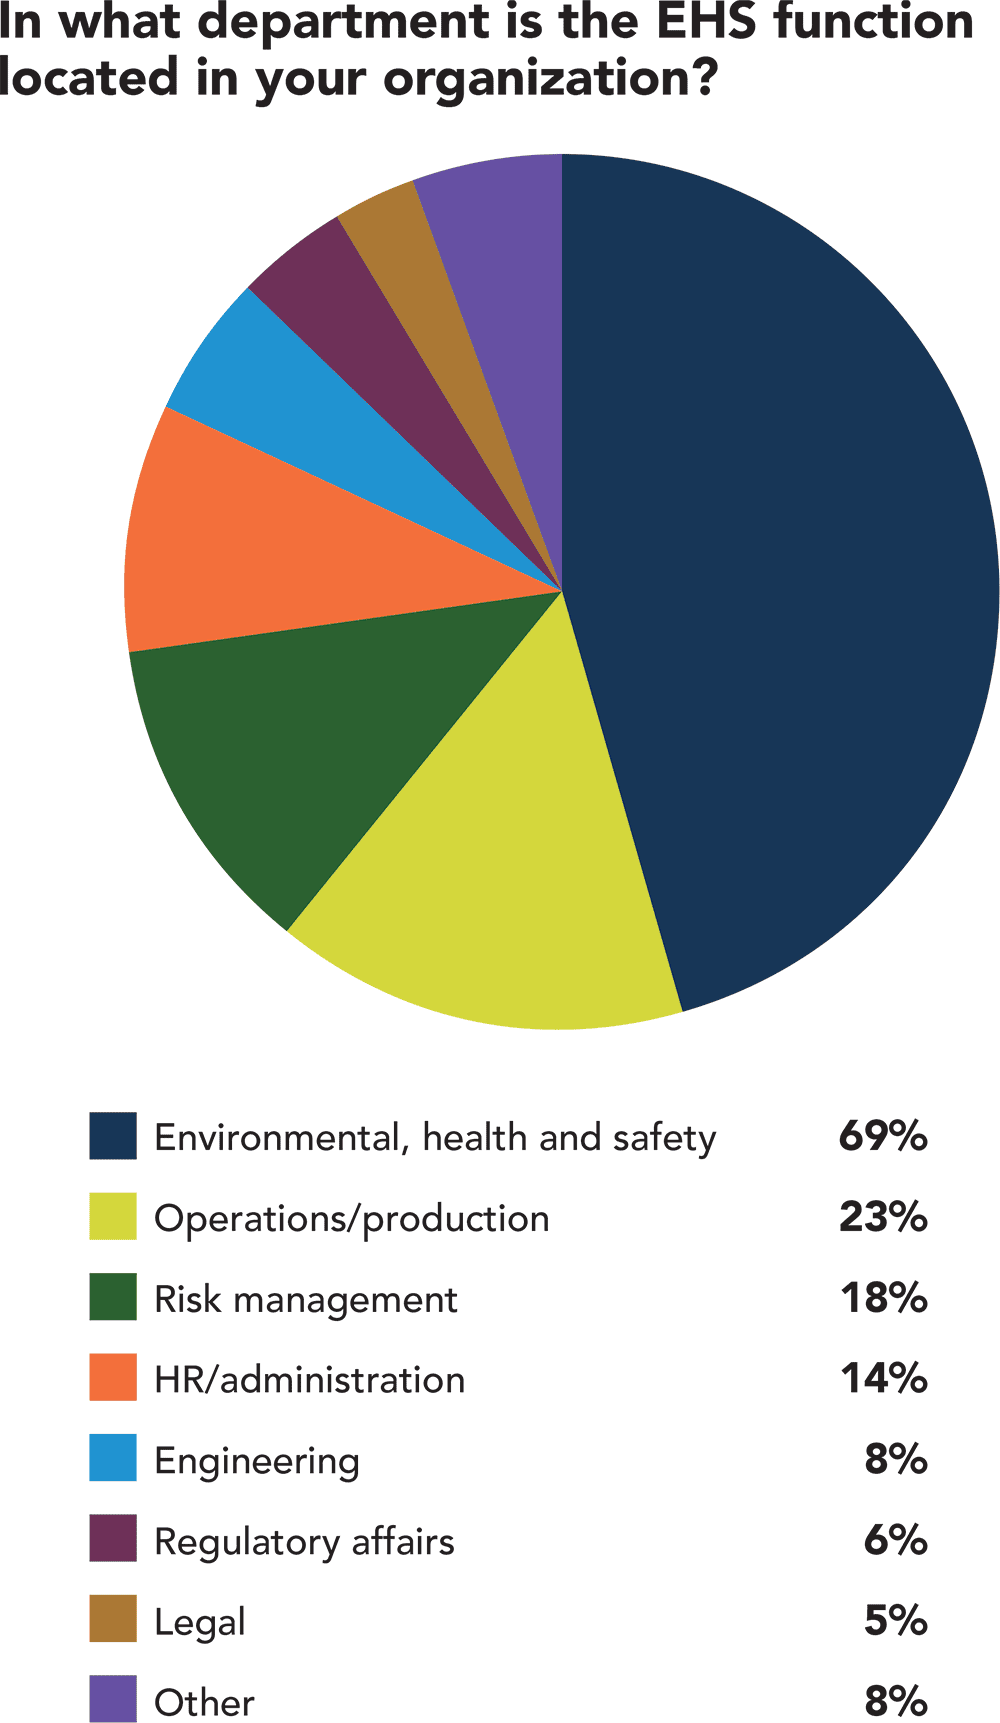
About your organization
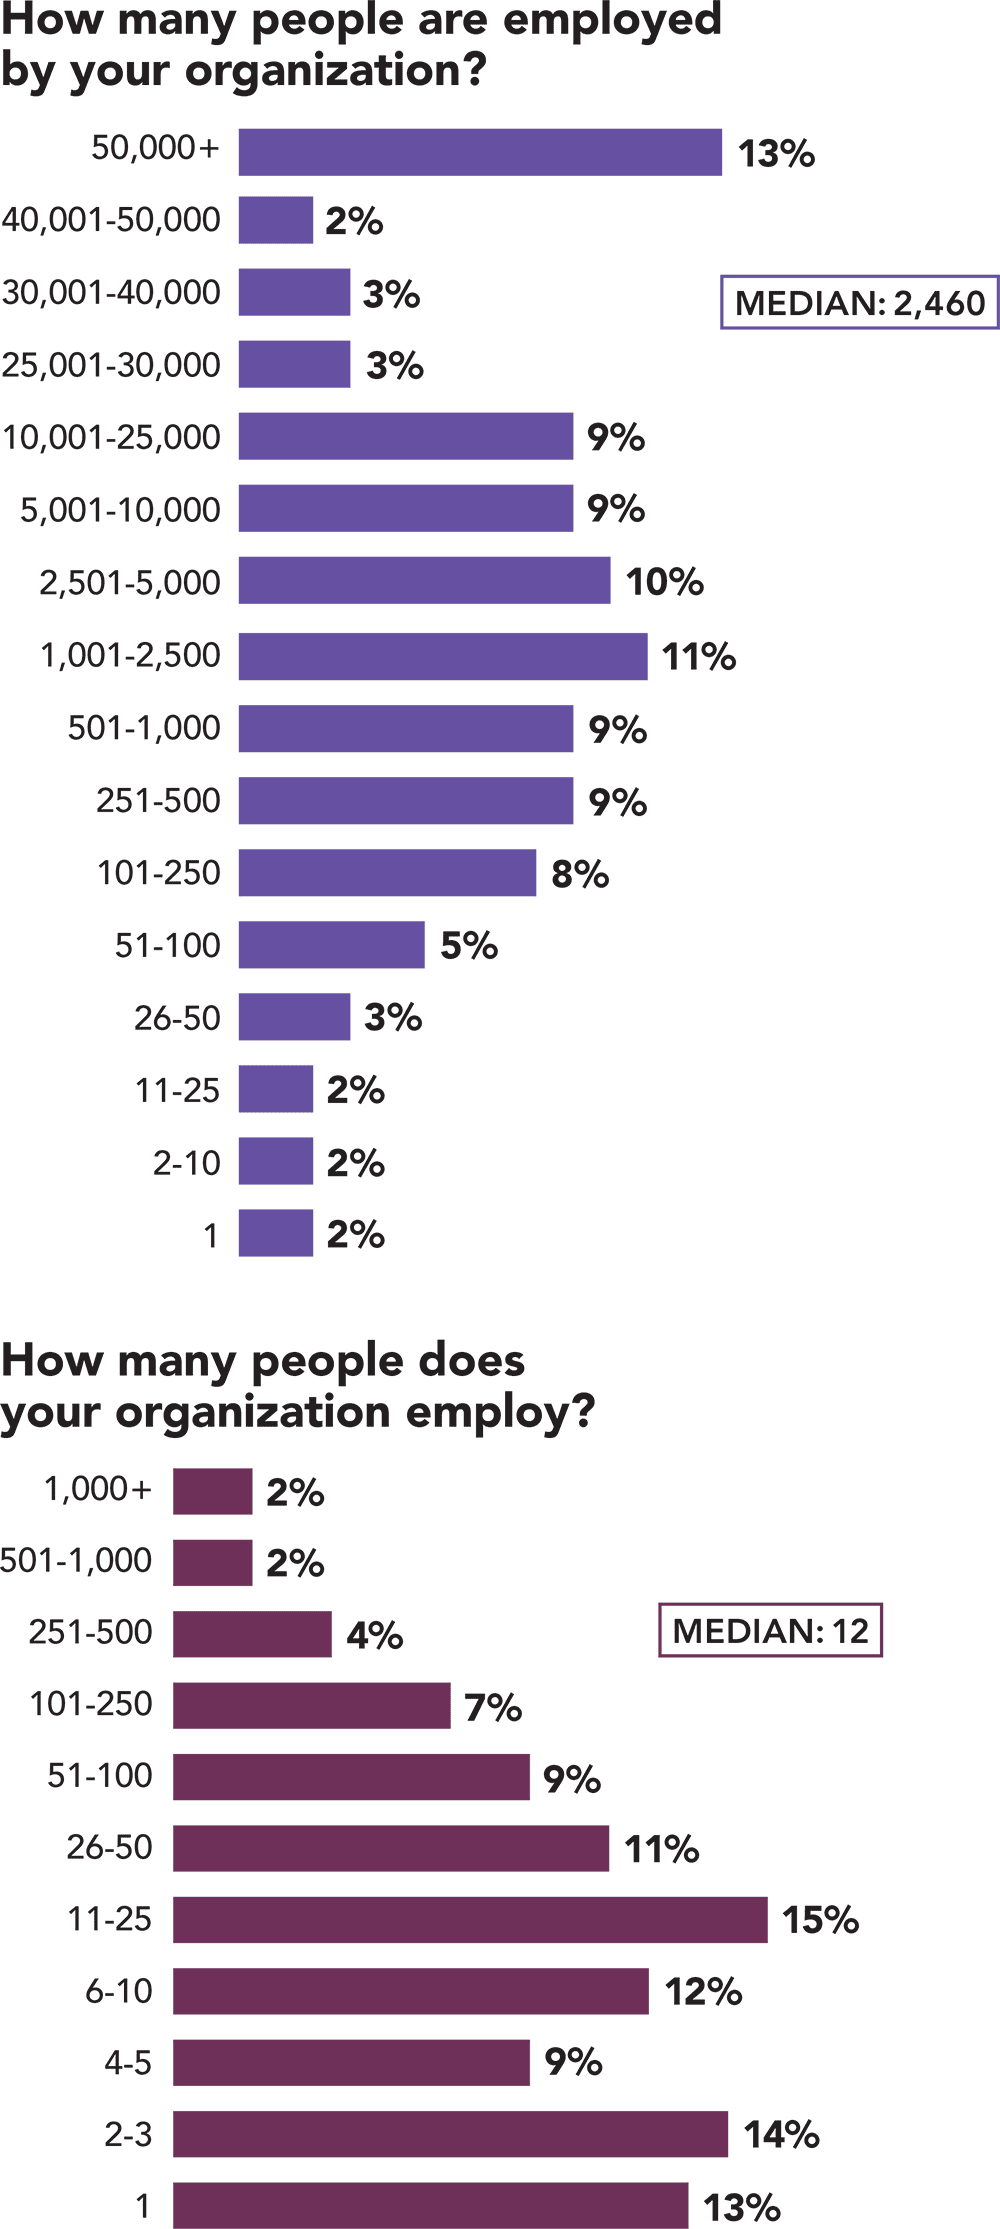
Note: Medians are reported in this study instead of means (averages) because medians represent the “typical” response and are not influenced
by extreme values. A median is the value that lies at the middle of a distribution; that is, 50% of the values are above it and 50% are below. Medians for grouped or categorical data are calculated by locating the group that contains the 50th percentile, then interpolating between the lower and upper bounds to estimate the precise value.
|
Sponsored by Columbia Southern University |
Next: About your work | > |
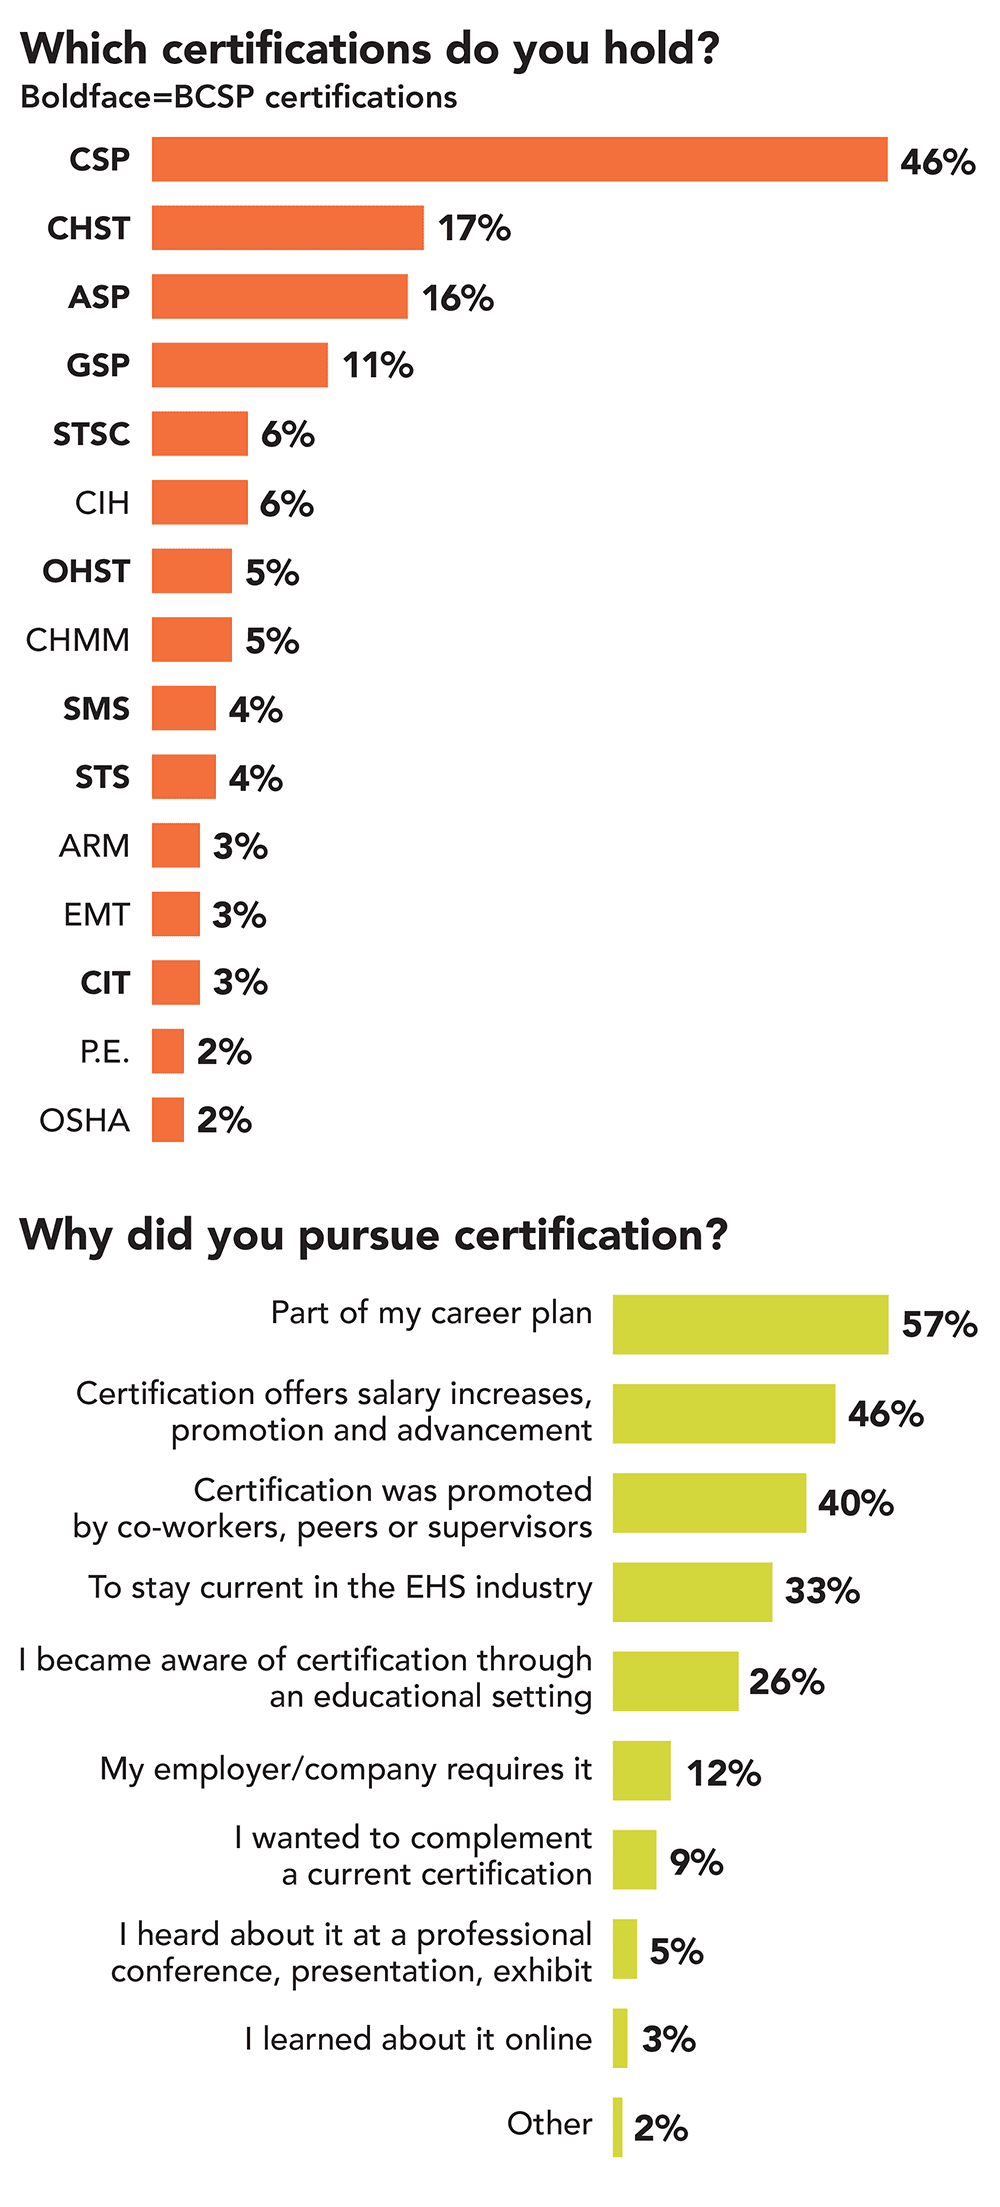
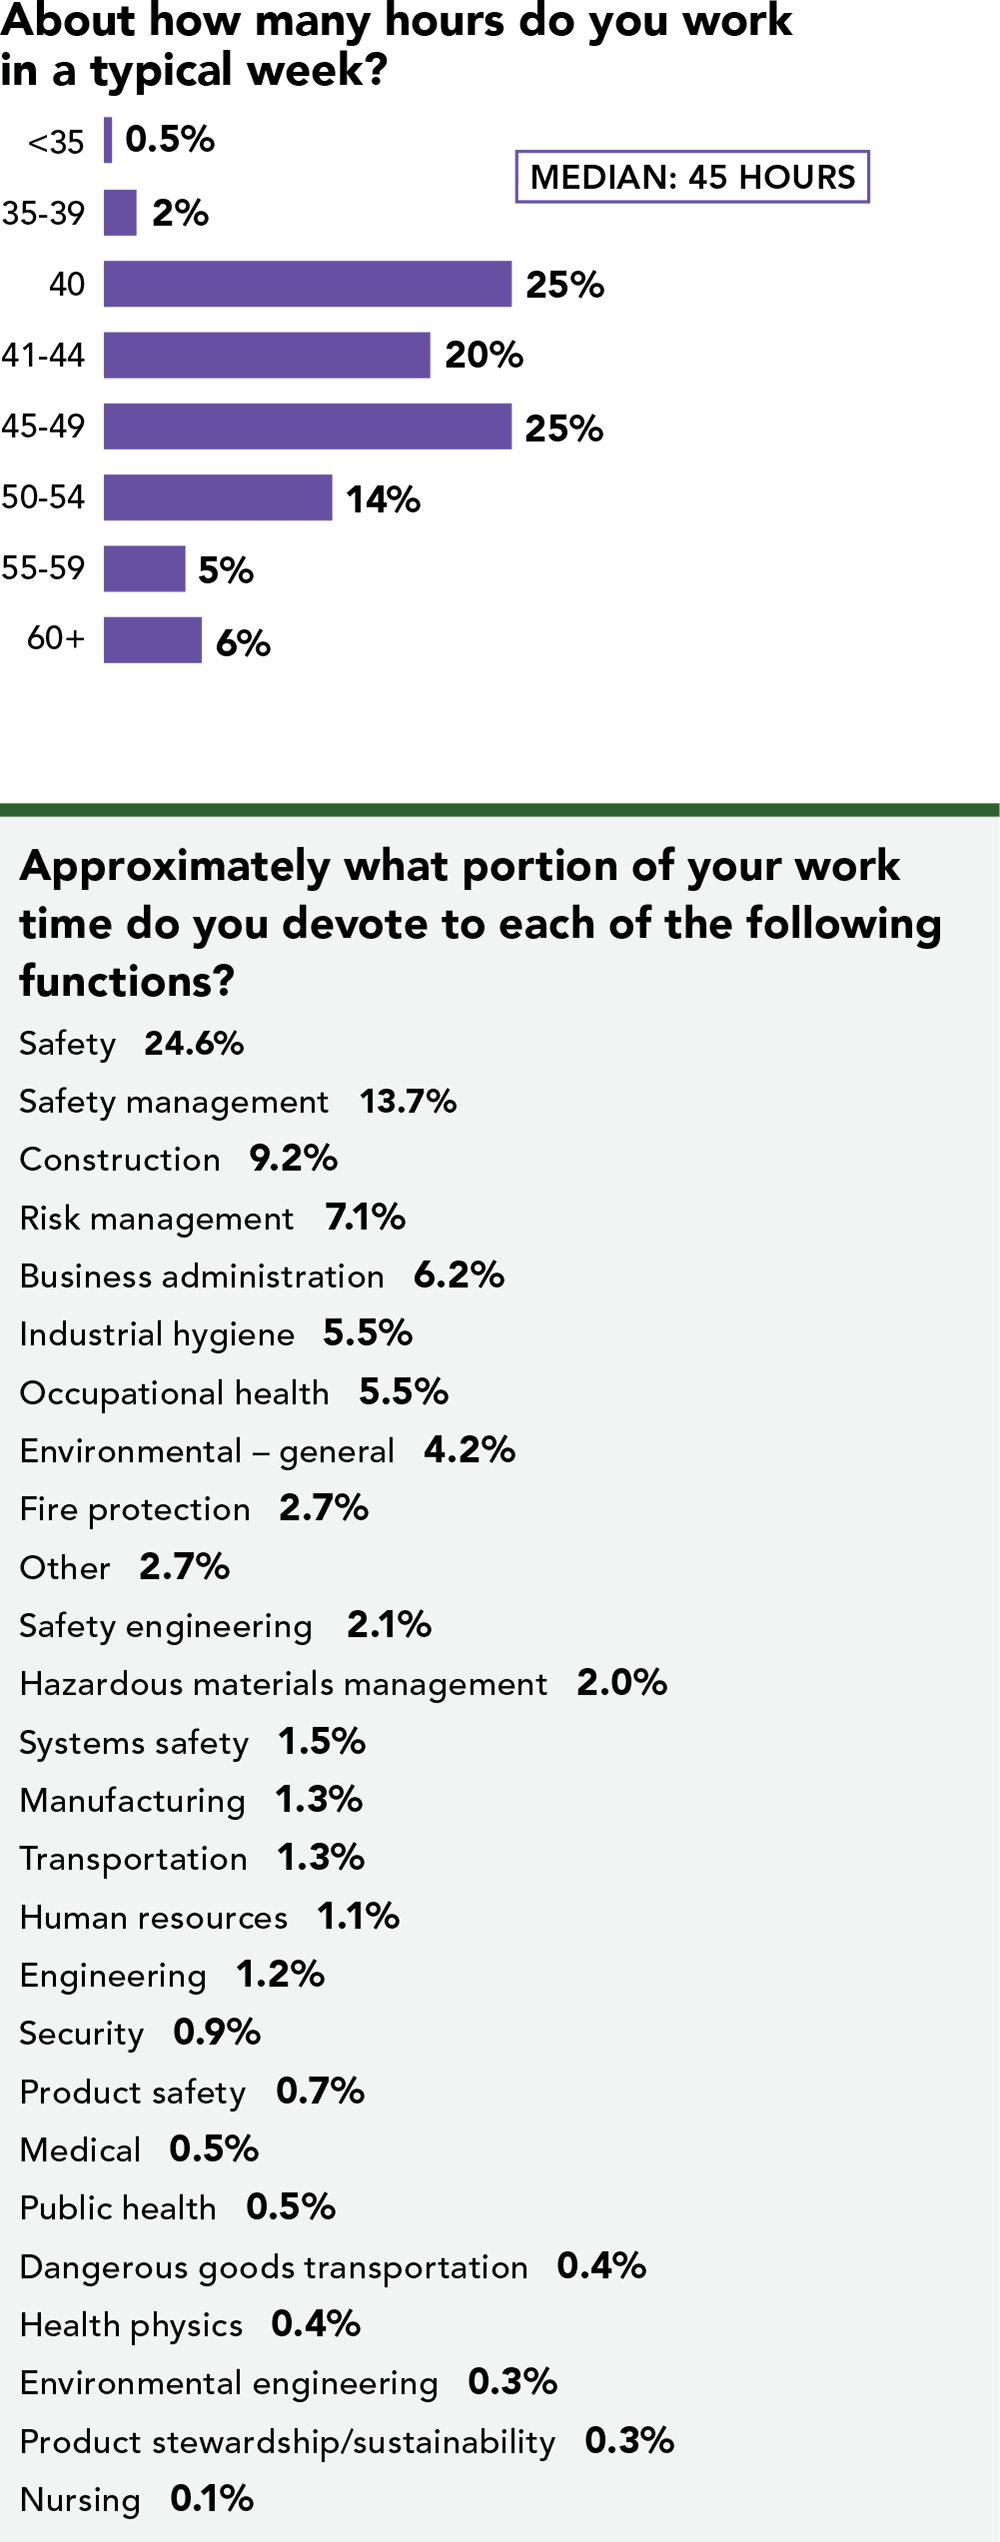
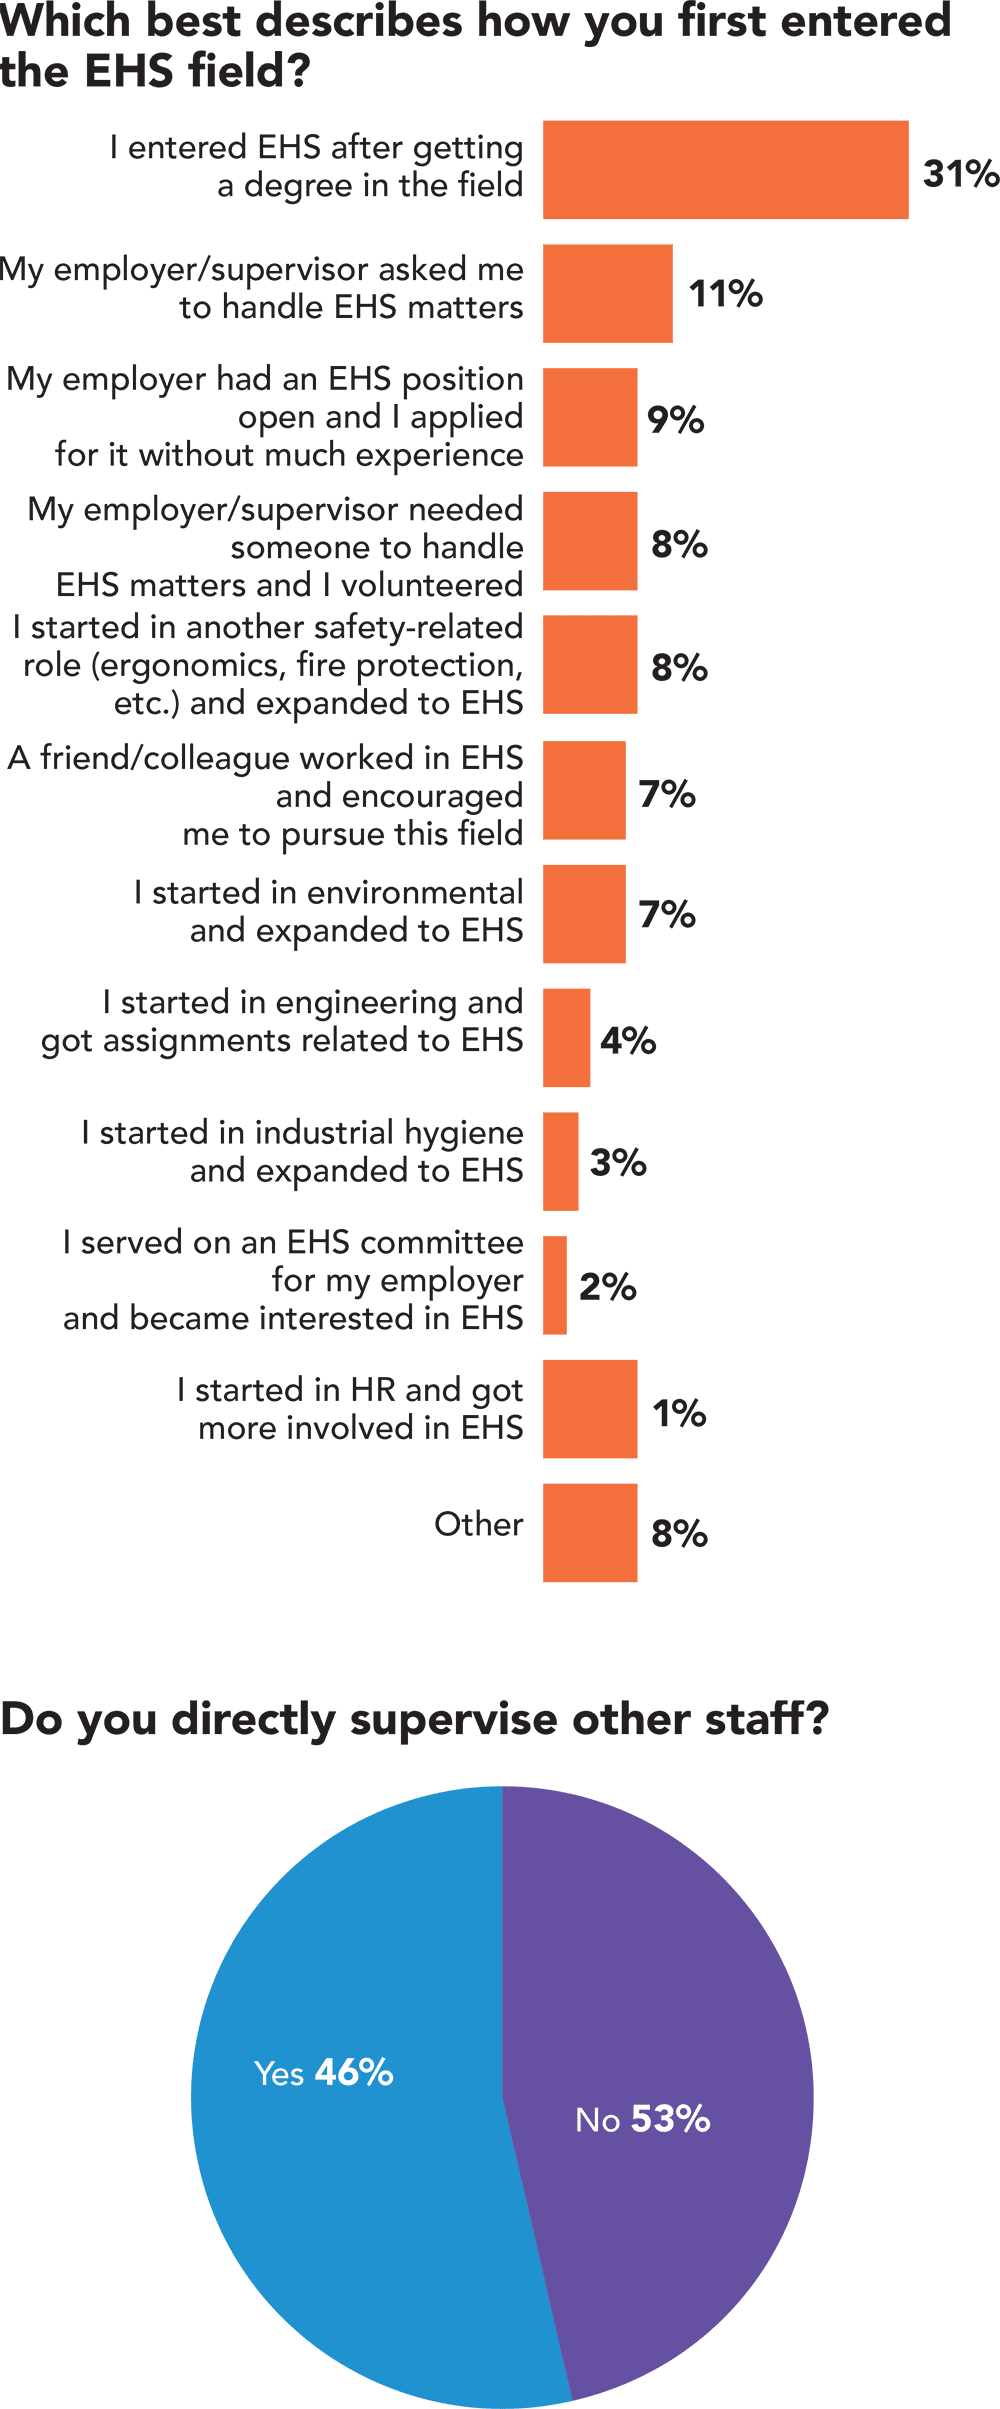
About your work
Note: Medians are reported in this study instead of means (averages) because medians represent the “typical” response and are not influenced
by extreme values. A median is the value that lies at the middle of a distribution; that is, 50% of the values are above it and 50% are below. Medians for grouped or categorical data are calculated by locating the group that contains the 50th percentile, then interpolating between the lower and upper bounds to estimate the precise value.
|
Sponsored by Columbia Southern University |
Next: Compensation | > |
Compensation
Note: Medians are reported in this study instead of means (averages) because medians represent the “typical” response and are not influenced
by extreme values. A median is the value that lies at the middle of a distribution; that is, 50% of the values are above it and 50% are below. Medians for grouped or categorical data are calculated by locating the group that contains the 50th percentile, then interpolating between the lower and upper bounds to estimate the precise value.
| < | Return to the beginning of the article |
Sponsored by Columbia Southern University |