
As a writer I’m loath to admit it, but sometimes words just can’t paint as clear of a picture as, well, a picture.
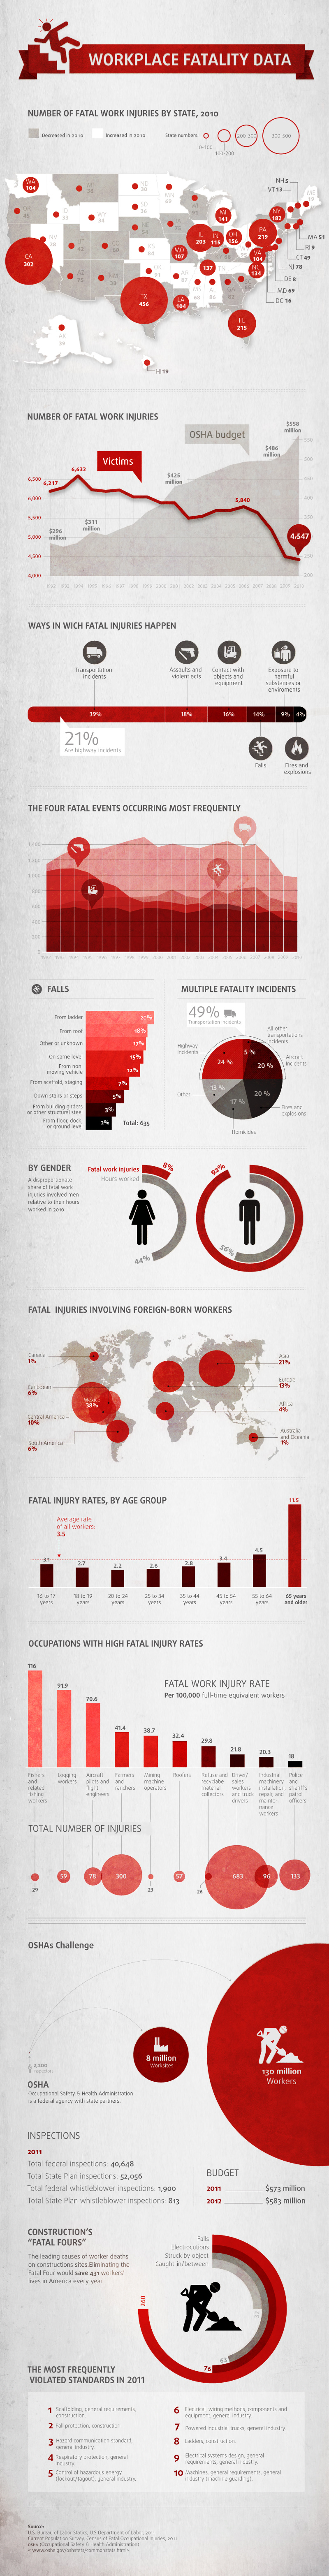
Take, for example, the infographic below. Created by online training company e-Training Inc., this graphic shows in clear black and white (and red) the toll that some jobs and workplace events have on the nation. Things have gotten better, sure, but as I said in a recent post, there’s always room for improvement.
(Hat Tip: Fascto Design, via The Huffington Post)
The opinions expressed in "Washington Wire" do not necessarily reflect those of the National Safety Council or affiliated local Chapters.